
SQLBlock 1 / warehouse
142 rowsSELECT
date_trunc('month', o.created_at) AS month,
s.name AS segment,
SUM(o.amount) AS revenue
FROM orders o
JOIN segments s ON s.id = o.segment_id
WHERE o.created_at >= '2026-01-01'
GROUP BY 1, 2
ORDER BY 1, 2;Platform capability
Ask a question and Kole builds an analysis notebook — SQL queries, Python with pandas and numpy, tables, charts, and written context — inside Quantum Lab.
Kole is available to authenticated SyneHQ team members inside Quantum Lab notebooks. Python runs via an in-browser runtime (Pyodide) with bundled data packages. Approval applies to configured agent-proposed consequential actions, not every query or read operation.
Kole / analysis notebook
SELECT
  date_trunc('month', o.created_at) AS month,
  s.name AS segment,
  SUM(o.amount) AS revenue
FROM orders o
JOIN segments s ON s.id = o.segment_id
WHERE o.created_at >= '2026-01-01'
GROUP BY 1, 2
ORDER BY 1, 2;import pandas as pd
import numpy as np
# Load revenue data from the SQL block above
df = pd.DataFrame(sql_result)
df['date'] = pd.to_datetime(df['month'])
df['revenue'] = df['revenue'].astype(float)
# Pivot by segment and compute monthly growth
pivot = df.pivot_table(
index='date',
columns='segment',
values='revenue',
aggfunc='sum'
)
growth = pivot.pct_change().iloc[-1].sort_values(ascending=False)
top_segment = growth.index[0]
print(f"Fastest growing: {top_segment} ({growth.iloc[0]:.1%})")Fastest growing: Growth (17.6%)
Revenue grew 18% across all segments in H1 2026.
The Growth segment accelerated fastest (+17.6% month-over-month in June), driven by 12 new accounts in Q2. Enterprise remained the largest contributor at $108k in June. Starter segment stayed flat.
Illustrative data -- values are not from a live database
Kole is an AI agent inside Quantum Lab notebooks. Ask a question about your connected data and Kole builds an analysis — pulling data with SQL, processing it with Python, rendering charts and tables from DataFrames, and writing up the results as markdown. The full notebook stays inspectable by your team.
Describe what you want to know and Kole identifies the relevant connections, tables, and schemas. It creates ordered notebook blocks — SQL to pull the data, Python to transform it with pandas and numpy, chart blocks to visualize the output, and markdown to explain the findings.
Kole can create up to 10 notebook blocks per step: a SQL query that extracts revenue data, a Python block that pivots it by segment with pandas, a chart that plots the trend, and a written summary of what changed. The result is a notebook your team can read, re-run, and extend.
The Python runtime starts on demand when a Python block is created. It includes pandas, numpy, scikit-learn, scipy, and other data packages. Table and chart outputs consume DataFrames produced by SQL or Python blocks.
When Kole proposes a configured consequential action — running SQL, creating notebook blocks, saving a query, or submitting a change — Quantum Lab presents it for your review. You can approve the proposal as-is, edit the SQL or Python before approving, or reject it with feedback.
Read-only discovery (inspecting connections, listing tables, reading schemas) runs automatically without approval. The gate applies specifically to configured consequential actions that create, modify, or execute work.
Kole / analysis outputs
Kole creates notebook blocks that produce DataFrame outputs — then renders them as charts and tables. The Python runtime includes pandas, numpy, scikit-learn, and scipy for deeper analysis.
Notebook chart outputs
Kole creates these from SQL and Python DataFrame results inside Quantum Lab.
Monthly revenue with area fill
python df.plot(kind='line', x='month', y='revenue')
Revenue distribution by plan segment
python df.groupby('segment')['revenue'].sum().plot(kind='pie')
Revenue vs activity by account tier
python df.plot.scatter(x='events', y='revenue', s='size')
Weekly retention from signup week
python cohort.pct_change().plot(kind='bar')
Chart outputs consume DataFrames from SQL or Python blocks. The Python runtime (Pyodide) loads packages on demand.
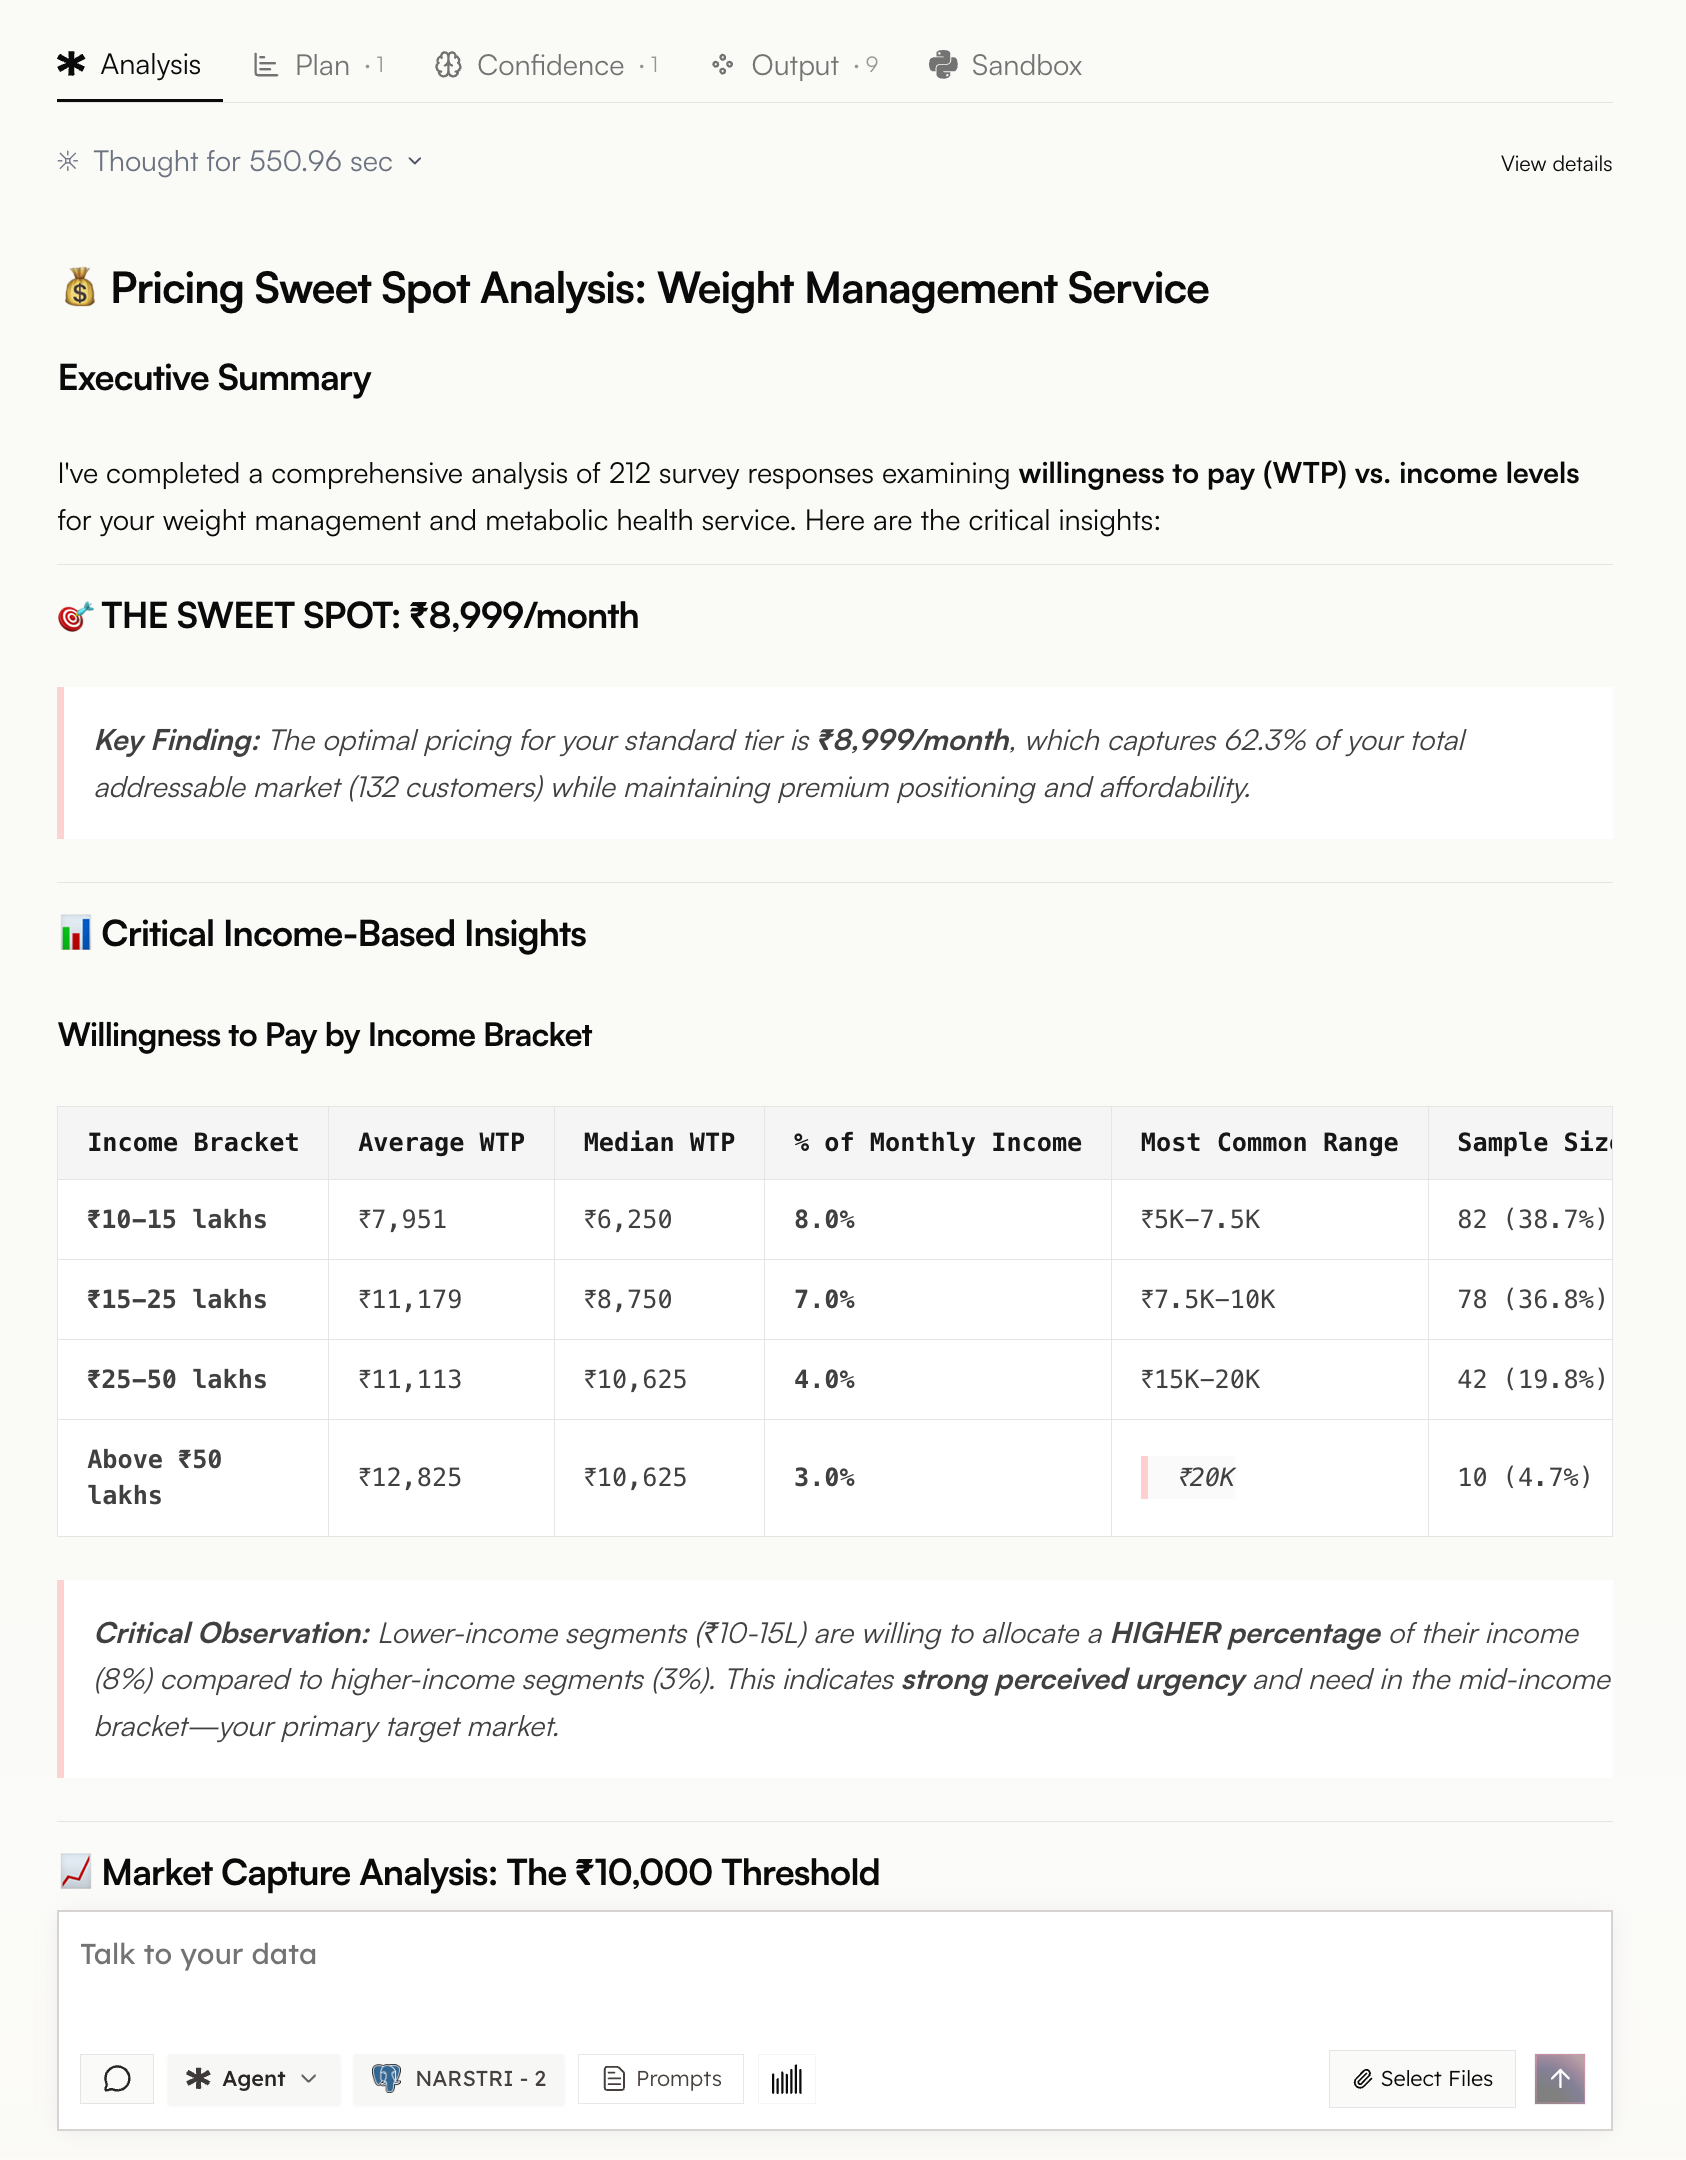
This is a real Kole session analyzing willingness-to-pay survey data. Kole processed 212 responses, segmented by income bracket, computed pricing sweet spots, and produced findings with tables and charts — all inside a single notebook run.
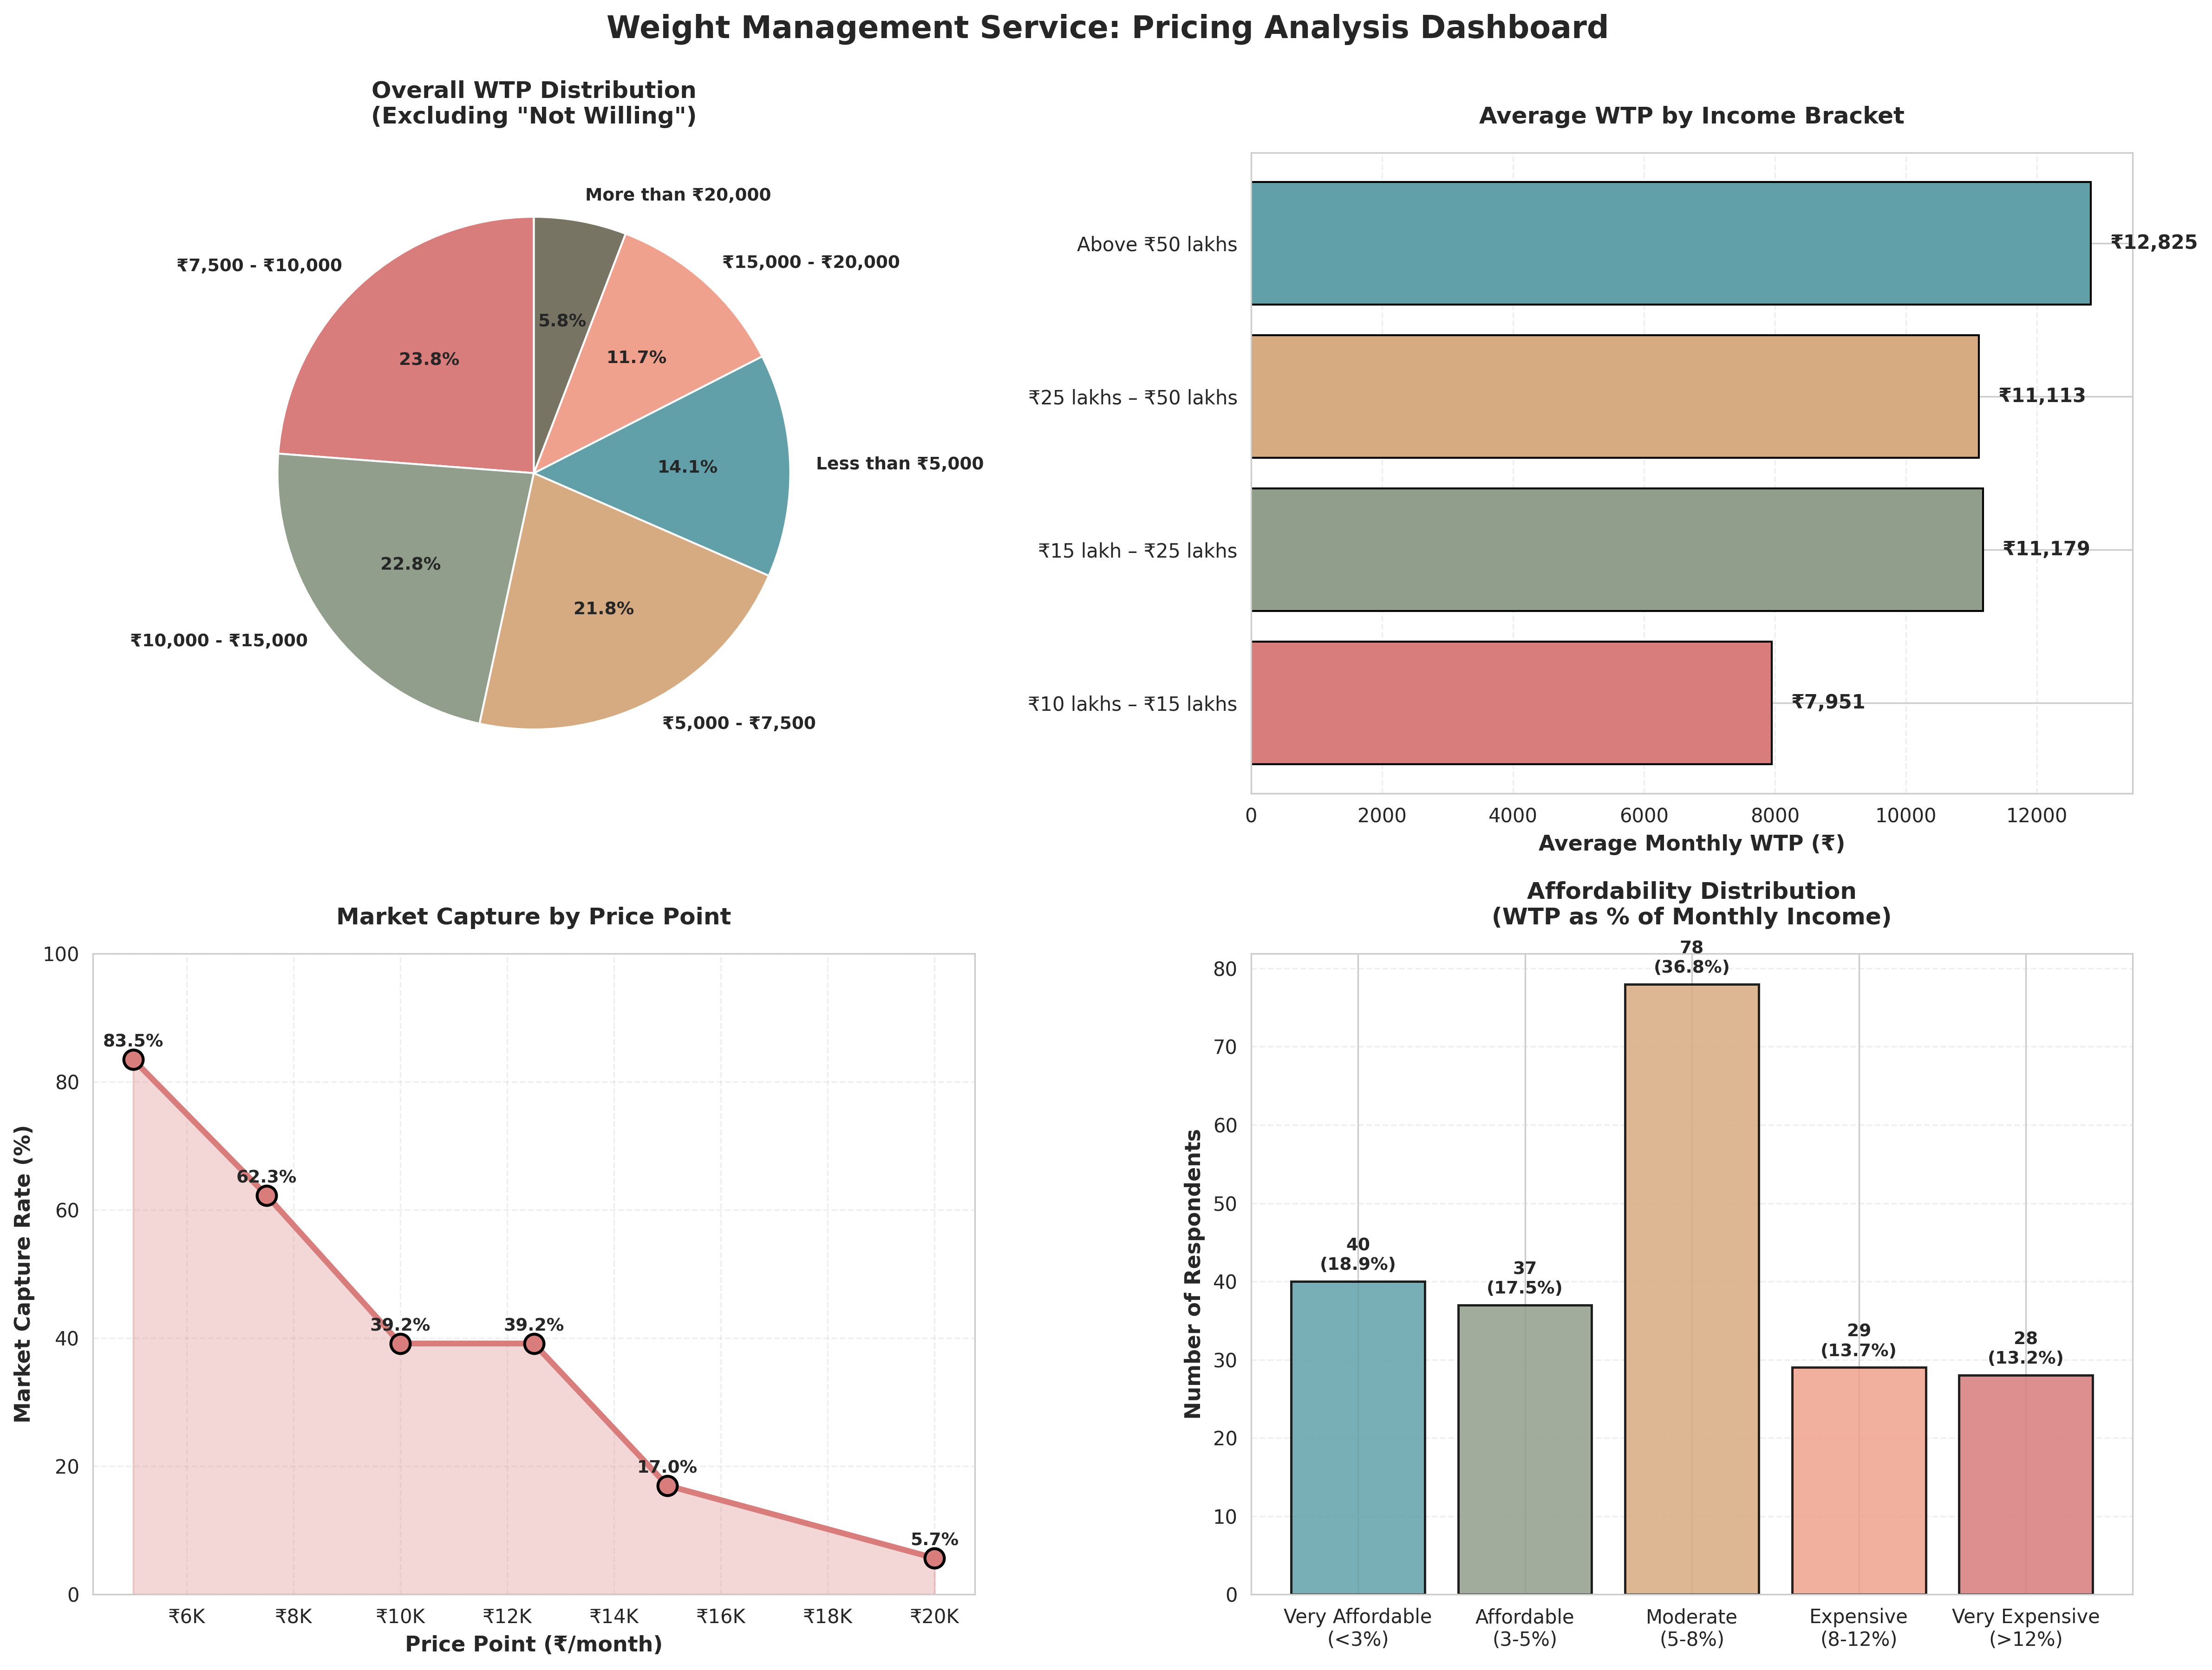
The same session produced a four-chart dashboard: WTP distribution, average WTP by income bracket, market capture by price point, and affordability distribution. Kole generated the charts from the DataFrame output of its Python analysis.
Kole works inside Quantum Lab notebooks where SQL blocks, Python blocks, charts, tables, and written context live together. A question that starts as a conversation becomes a notebook your team can audit, re-run against fresh data, and build on.
Use Kole when the analysis needs more than a single query — when you want to pull data from a connection, reshape it with pandas, plot a trend, and explain the result in one place. The notebook retains the conversation, the code, the outputs, and any approved changes for your team to revisit.